Work in progress. This is the current stable version.
This allows you to explore some passive solar features but is still fairly simplistic. It allows you to create an insulated box with at most two windows per side and with an optional thermal mass. The sun and weather data for the year is TMY2 data currently only for Philadelphia, USA.
You first choose the box dimensions, number of windows and their dimensions, the insulation R-value, the type and dimensions of a thermal mass and the number of air changes per hour. Once you've set your parameters, click on the Recalculate chart button and the internal temperature of the box over the course of a year will be calculated and displayed in the chart below.
Once you've done a recalculation, the web address in the brower's URL box will contain all your parameters in case you want copy it into an email to send to someone else to look at. I can't promise that the format of this URL won't change in the future.
There's more detailed information below the chart about what's being done.
|
|
This has its origins in a passive solar cube algorithm produced by Nick in the SolarHeat Yahoo group. I've since added a few calculations of my own and broadened it (the original cube had just one window and thermal mass.)
It is still fairly simplistic though since there are no air changes and all six surfaces, roof and floor included, are treated the same as walls with the same insulation and heat loss. The sunlight is applied to the south facing windows only though all windows are taken into account when calculating losses. The thermal mass gets its heat from the surrounding air in the box and not from any direct sunlight.
Effect of thermal mass
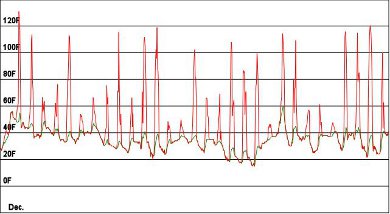
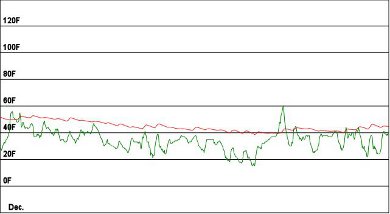
There is one thing I've found particularly interesting so far and that's to compare the chart results with and without a thermal mass. This works well if you set the time period to a month and ask to show the outdoor temperature. With no thermal mass the box temperature fluctuates a lot in sync with the outdoor temperature. With a thermal mass the box temperature is smoothed significantly. If you have trouble figuring out how to set this up click here for without thermal mass and here for with thermal mass.
The two charts below are the results you'll see. Notice the very hot temperatures reached without a thermal mass. Keep in mind that this box loses heat buy conduction only. It has no air leaks whatsoever and has a floor that behaves the same as a wall, i.e. no concrete base connected to the ground. However, this does illustrate the temperature smoothing effect of a thermal mass well.
|
|
Effect of air changes
The number of air changes per hour is the number of times the volume of air in the hour is removed and replaced with outdoor air and is one of the setable parameters above. This is often due to leaks around window and door frames, around the sill at the top of the basement wall, to name a few. It's also due to opening and closing of windows and doors and due to kitchen range hoods and bathroom exhaust fans. In a house with a heat recovery ventilator it's a deliberate thing. Air changes are recommended for purposes of air quality.
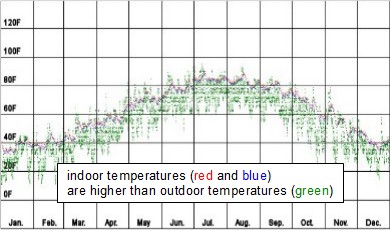
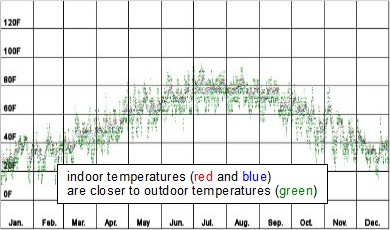
As expected, the more air changes per hour, the more the indoor temperature follows the outdoor temperature as shown in the two sample charts below. The one on the left has 0.5 air changes per hour and the one on the right has 3 air changes per hour. The green dots are the outdoor temperature and the red is the indoor highest daily temperature and the blue is the lowest. Clearly in the chart on the right with 3 air changes per hour, the indoor temperatures as indicated by the red and blue are closer to the outdoor temperatures, the green. To get the settings for the chart on the left click here and for the one on the right click here.
|
|