How to read a Sun Chart for solar site surveys
A Sun Chart is used by various shade finding tools to show year round shading for solar applications. Get a sun chart for your location here. I've used it for this very simple to make DIY shade finder consisting of paper and cardboard elevation and azimuth gages. I've also used it for a very cool, much faster operating shade finder of my own design. The Solar Pathfinder is a commercial shade finder tool that also uses a Sun Chart.


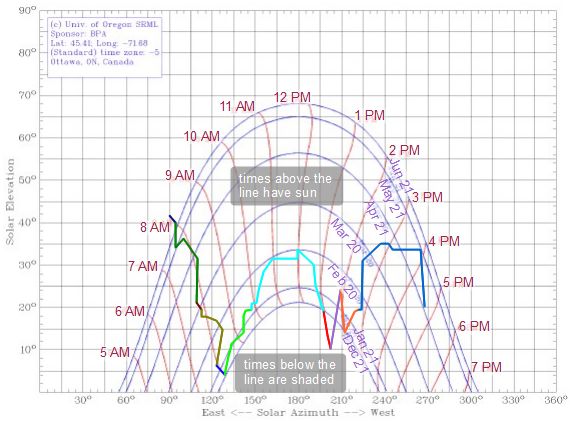
The purple curvey lines in the chart above represent different days of the year. June 21st is the day when the sun is highest in the sky and is represented by the topmost purple line. May 21st is the next line in. So everything between those two lines represents the time between May 21st and June 21st.
The red curvey lines represent the time of day.
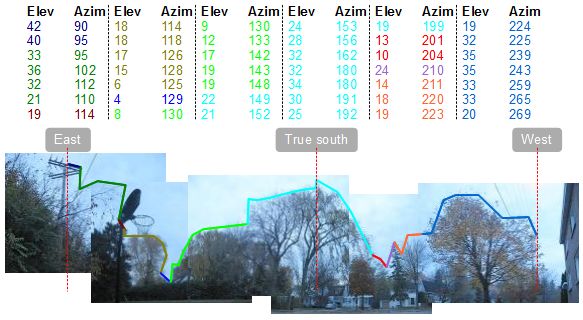
The multicolored line is the plot I made using my elevation and azimuth data (see the table above.) Everything below the line is shaded. Everything above the line has sun.
Looking at May 21st to June 21st, you can see that the location where I made the measurements from is no longer shaded after around 7:45 AM to 8:00 AM. Contrast that with April 21st to May 21st where shading ends around 8:00 AM but begins again between 3:30 PM and 4:00 PM. And the period from December 21st to January 21st is hopelessly shaded pretty much all the time.
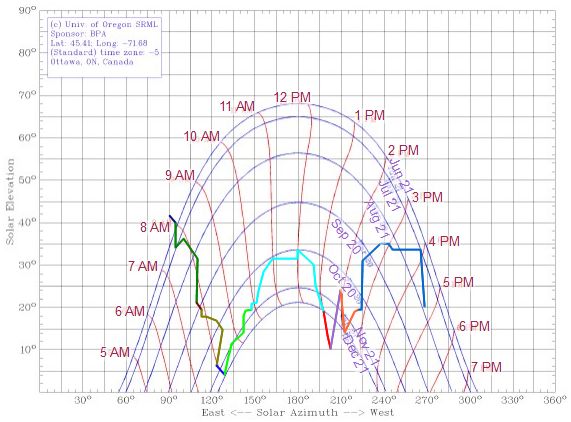
But what about July, August, September, October and November? On December 21st the arc that the sun makes across the sky is at its lowest. After that it gradually gets higher, peeking on June 21st. From June 21st to December 21st, including our missing months, the sun's arc simply reverses direction, getting lower each day.
So we can simply change the dates on the Sun Chart to account for the missing months, as I've done manually below. Now we can see that November 21st to December 21st is also hopelessly shaded all day.

